Корзина
Поиск
Книги автора Рендген Сандра
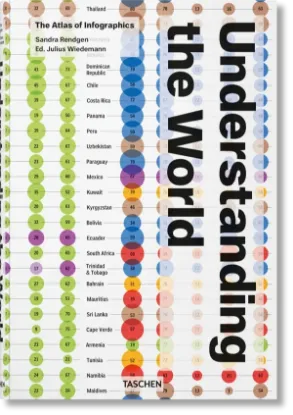
Understanding the World. The Atlas of Infographics
3465 грн
Understanding the World. The Atlas of Infographics / Автор: Sandra Rendgen, Издательство: Taschen, Серия: , Страниц: 456, Переплет: Твердый, ISBN: 9783836594967
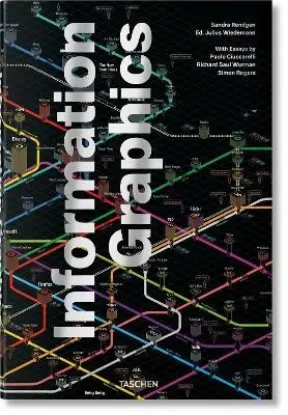
Information Graphics
2200 грн
Graphs, maps, stats, and diagrams: this collection of infographics explores the development of visual communication in the big data age. More than 400 exemplary graphics—ranging from journalism to art, government to education—are accompanied by essays tracing the evolving art form that is pictorial explanation. Complete with in-depth fact sheets explaining each graphic project. Hardcover with poster, 21 x 31.5 cm, 2.43 kg, 480 pages
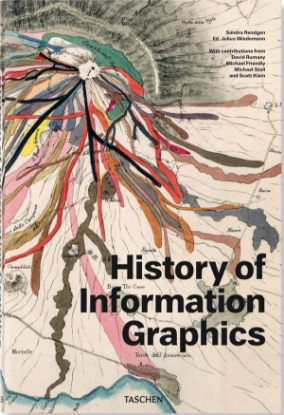
History of Information Graphics
3465 грн
From cosmic charts and da Vinci’s Vitruvian Man to the New York subway map: trace the history of visual data from the Middle Ages to the digital era in this XL compendium. Featuring some 400 infographic milestones across technology, cartography, zoology, and more, this is an unprecedented reference work for designers, history buffs, and anyone thirsty for knowledge. Hardcover with six fold-outs, 24.6 x 37.2 cm, 3.79 kg, 462 pages


